Overview Top 10 Holdings Fixed Income by Asset Class Underlying Holdings Key
Statistics – Fixed Income Equities by Region Underlying Holdings Key
Statistics – Equities Last 3 Years Annualised
Volatility Performance After Fees Growth of £100,000 Rolling Return Fees & Charges Monthly Asset Allocation
Changes and Market
Commentary Key Themes
Download factsheet
Overview
Latest Factsheet and Market Commentary as at 30 September 2026 Portfolio commenced 31 May 2011 OBJECTIVE:
To substantially outperform cash whilst aiming to reduce downside risk. Please note that whilst we aim to achieve positive returns over three-year rolling periods, there is no guarantee that such a return will be achieved over this or any other period.
STRATEGY:
Actively managed and may be all equity, all bonds or all cash. It normally invests in a wide range of ETFs to gain significant diversification and exceptional liquidity at very low cost.
Overall Asset Allocation Top 10 Holdings
| Stock Short Name | Percentage of Portfolio |
|---|---|
| Vanguard U.K. Gilt UCITS ETF | 16.1 |
| iShares Core UK Gilts UCITS ETF | 16.1 |
| State Street SPDR Bloomberg 15+ Year Gilt UCITS ETF | 10.8 |
| iShares $ Floating Rate Bond UCITS ETF GBP Hedged | 7.7 |
| State Street SPDR Bloomberg Sterling Corporate Bond UCITS ETF | 7.5 |
| iShares Core £ Corp Bond UCITS ETF | 5.5 |
| Invesco UK Gilt 1-5 Year UCITS ETF | 5.4 |
| iShares £ Ultrashort Bond UCITS ETF | 5.1 |
| Amundi UK Equity All Cap UCITS ETF | 4.4 |
| iShares Core MSCI EM IMI UCITS ETF | 4.3 |
| Number of Holdings | Yield to Maturity | Maturity | Duration | S&P Rating |
|---|---|---|---|---|
| 143 Govt. Bonds 1,770 Corp. Bonds | 5.33% | 10.06 | 6.36 | A+/A |
| Number of Holdings | Best Dividend Yield Forward 12m | Best Price to Book Forward | Best P/E Ratio | Best LTG EPS |
|---|---|---|---|---|
| 7,414 | 3.6% | 2.0 | 12.7 | 12.9% |
| 50/50 Bond Reserve/Absolute Return | 5.1% |
|---|---|
| Asia Pacific Ex. Japan (MSCI Asia Ex Jap) | 18.30% |
| Em Markets (MSCI EM) | 17.3%% |
| Japan (MSCI Japan) | 14.60% |
| US Equities (MSCI USA) | 12.50% |
| Europe Excl UK (MSCI Eur. Ex UK) | 11.10% |
| UK Equities (MSCI UK) | 9.40% |
| UK Index-Linked Gilts (Barclays UK Infl Linked) | 8.78% |
| UK Gilts (Bloomberg UK Govt All>1 Yr) | 7.00% |
| UK Corp Bonds (iBoxx Large Cap TRI Index) | 5.20% |
Performance is based on the monthly performance of the first client discretionary portfolio after all charges. Individual client portfolios may differ due partly to differences in the timing of initial investment or withdrawals or rebalancing. The SCM 50/50 Bond Reserve / Absolute Return (£) Benchmark is the average of cash (Barclays Benchmark Overnight GBP Cash Index) and inflation (the return of the UK RPI All Items Index). Competitor data is based on the average performance of the IA Global Mixed Bond and the IA Targeted Absolute Return Sectors and the comparison is offered as a guide only.
Rolling Return
| 12m to 30/09/2021 | 12m to 30/09/2022 | 12m to 30/09/2023 | 12m to 30/09/2024 | 12m to 30/09/2025 | 12m to 30/09/2026 |
|---|---|---|---|---|---|
| 7.6% | -15.9% | 8.9% | 9.9% | 5.7% | 4.8% |
Source: SCM Private LLP
Past performance is not a guide to future returns. The value of investments and the income from them can go down as well as up, so investors may not recover the amount of their original investment. Fee & Charges
| ALL Fees & Charges | Percentage |
|---|---|
| SCM Discretionary Fund Management Charge | 0.40% |
| Underlying ETF costs (KIID Ongoing Charge) | 0.13% |
| Transaction Costs of buying/selling funds | 0.12% |
| Transaction Costs within funds | 0.02% |
| Custody & Administration Fee | 0.12% |
| Total Fees & Charges | 0.79% |
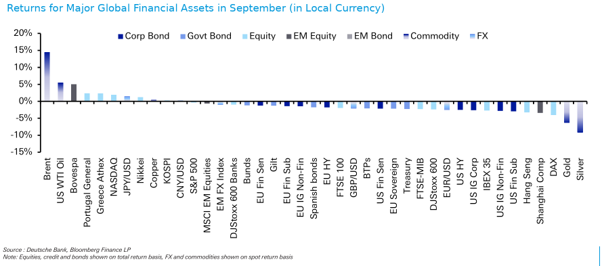
The bond market stopped being ignored. Equities ended the quarter near their highs, but government bonds fell across the board. The 10-year US Treasury yield rose for a seventh consecutive month, the longest run since 2011, and ended September at 5.28%, its highest since 2007. Brent rose 14% in September and 42% over the quarter; gold fell 6%.
The chart below shows September across the world’s major assets: oil and Brazil at one end, precious metals, the DAX and Hong Kong at the other.
Seven months of dearer money
Every major central bank tightened in the third quarter: the Federal Reserve for the first time since 2023, the ECB alongside it, and the Bank of Japan at its fastest pace since 1990. US Treasuries fell 3.2% over the quarter, and euro-area sovereigns 4.4%. Equities held on, narrowly: the S&P 500 made a new high on 6 October, with 40% of its members lower than in March. US inflation has risen to 3.7%. As we said last month, the risk lies in borrowing, not in share prices.
Oil, gilts and the Budget
With Hormuz still contested, Brent ended the quarter at $103.53, and the six-month forward price is at a record. The market is pricing a prolonged disruption, not a spike. In the UK, this comes a fortnight before the 28 October Budget. Borrowing is £8.1bn above the OBR’s profile, and the 10-year gilt reached 5.44% on 7 October, a 19-year high, with markets pricing a Bank Rate rise from 3.75% to 4.75% by next summer.
We think much of the alarm is misplaced
The UK was the fastest-growing G7 economy in the first half; 10-year gilt yields are two percentage points above inflation and barely one above their average since 1711; and some analysts expect just one more hike, followed by cuts. Yet 48% of fund managers remain underweight in bonds: we believe the crowd is on the wrong side.
SCM Direct/MoneyShe Portfolios: what we changed, and why
On 17 September, we trimmed Japan and broad, index-weighted emerging markets by 1.25 percentage points each, and introduced two emerging-market income holdings, each at 0.6%: the Invesco FTSE EM High Dividend Low Volatility ETF and the iShares EM Dividend ETF. Japan is no longer cheap at 18 times earnings; the new holdings trade at 9.4 and 8.7 times and yield 6.1% and 6.8%, against 14.6 times and 2.1% for the broad, technology-heavy index.
The larger change was in bonds. We shifted two percentage points from our three sterling corporate bond holdings into the SPDR Bloomberg 15+ Year Gilt ETF. With the equity proceeds, the gilts allocation rises from 7.75% to 11%, taking gilts of all maturities to 49% of the portfolio. Equities fall from 22.5% to 21.25%.
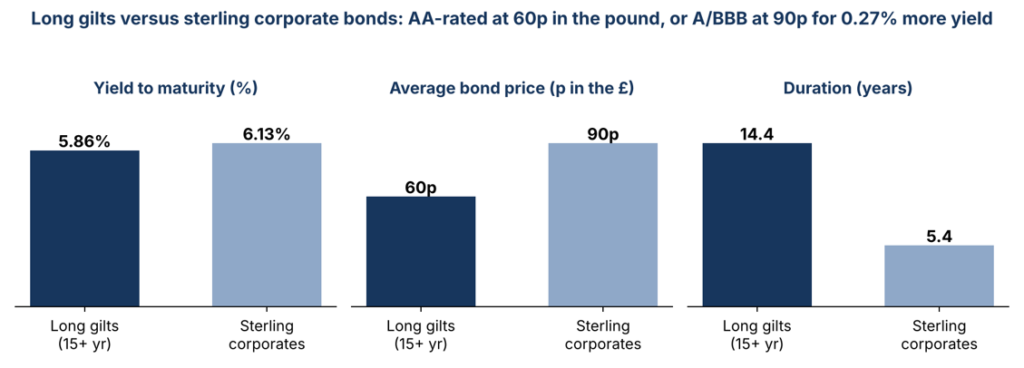
The sterling corporate bond index yields 6.13%, with an average rating of A3/BAA1 and a credit spread of just 0.93% over gilts. The long-gilt index yields 5.86%, is rated AA3, and trades at an average price of 60p in the pound, which will revert to par as the bonds mature. For 0.27% yield, we give up a BBB-flavoured credit risk the market barely pays us to take and buy UK government at a 19-year high in yields.
We do not chase records. The styles we favour, namely low volatility, quality, dividends and value, lagged the rally all year and now trade at depressed valuations; September’s changes lean further towards them. We remain focused on capital preservation, valuation discipline and genuine, look-through diversification.
Alan Miller, Chief Investment Officer
17 October 2026