
50/50 Bond Reserve/Long-Term Return Portfolio
Overview
To outperform inflation.
Actively managed with a long-term bias to real assets e.g. equities. The Portfolio normally invests in a wide range of ETFs to gain significant diversification and exceptional liquidity at very low cost.
| Top 10 Holdings | % of Portfolio |
|---|---|
| iShares Core UK Gilts UCITS ETF | 14.6 |
| SPDR Sterling Corporate Bond UCITS ETF | 7.6 |
| iShares Core MSCI EM IMI UCITS ETF | 7.2 |
| SPDR Bloomberg 15+ Year Gilt UCITS ETF | 7 |
| ISHARES II PLC-USD FLTG RATE BOND U | 6.9 |
| Amundi UK Equity All Cap UCITS ETF | 6 |
| iShares Core £ Corp Bond UCITS ETF | 5.6 |
| iShares Core FTSE 100 UCITS ETF | 5.3 |
| Invesco UK Gilt 1-5 Year UCITS ETF | 4.8 |
| iShares Core MSCI EM IMI UCITS ETF | 11.4 |
| Number of Holdings | Yield to Maturity | Maturity | Duration | S&P Rating |
|---|---|---|---|---|
| 144 Govt. Bonds 1,665 Corp. Bonds | 4.99% | 9.74 | 6.26 | A/A- |
| Number of Holdings | Best Dividend Yield Forward 12m | Best Price to Book Forward | Best P/E Ratio | Best LTG EPS |
|---|---|---|---|---|
| 7,775 | 3.11% | 2.0 | 14.2 | 11.9% |
| 50/50 Bond Reserve/Long-Term Return | 5.5% |
|---|---|
| Asia Pacific Ex. Japan (MSCI Asia Ex Jap) | 16.4% |
| Em Markets (MSCI EM) | 15.9% |
| Japan (MSCI Japan) | 14.4% |
| US Equities (MSCI USA) | 12.3% |
| UK Equities (MSCI UK) | 10.4% |
| UK Index-Linked Gilts (Barclays UK Infl Linked) | 9.7% |
| Europe Excl UK (MSCI Eur. Ex UK) | 9.6% |
| UK Gilts (Bloomberg UK Govt All>1 Yr) | 7.2% |
| UK Corp Bonds (iBoxx Large Cap TRI Index) | 5.6% |
Performance is based on the monthly performance of the first client discretionary portfolio after all charges. Individual client portfolios may differ due partly to differences in the timing of initial investment or withdrawals or rebalancing. The SCM 50/50 Bond Reserve / Long-Term Return (£) Benchmark is the average of cash (Barclays Benchmark Overnight GBP Cash Index) and inflation (the return of the UK RPI All Items Index). Competitor data is based on the average performance of the IA Targeted Absolute Return and the IA Mixed Investment 40-85% Shares Sectors and the comparison is offered as a guide only.
| 12m to 31/03/2021 | 12m to 31/03/2022 | 12m to 31/03/2023 | 12m to 31/03/2024 | 12m to 31/03/2025 | 12m to 31/03/2026 |
|---|---|---|---|---|---|
| 18.9% | -1.4% | -4.5% | 8.5% | 2.9% | 9.1% |
Source: SCM Private LLP
The performance of the 50/50 portfolios has been calculated as the average performance of the two underlying portfolios after costs, from the common date of inception.
Past performance is not a guide to future returns. The value of investments and the income from them can go down as well as up, so investors may not recover the amount of their original investment.
| ALL Fees & Charges | Percentage |
|---|---|
| SCM Discretionary Fund Management Charge | 0.40% |
| Underlying ETF costs (KIID Ongoing Charge) | 0.13% |
| Transaction Costs of buying/selling funds | 0.12% |
| Transaction Costs within funds | 0.04% |
| Custody & Administration Fee | 0.12% |
| Total Fees & Charges | 0.81% |
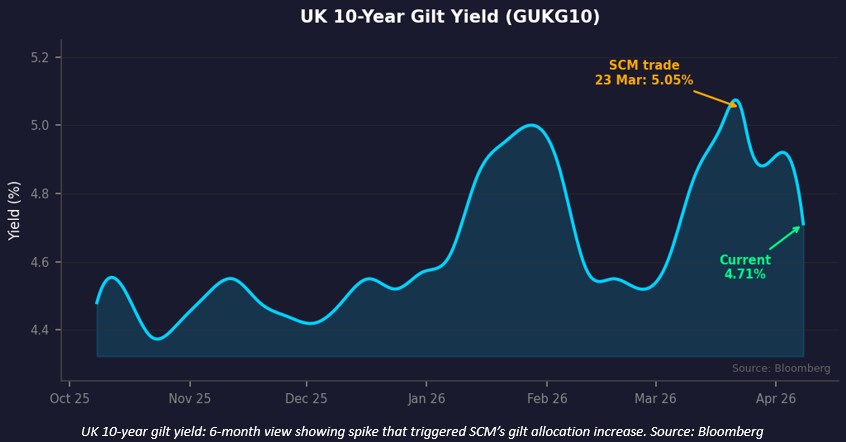
During March, SCM/MoneyShe increased its allocation to UK government bonds (gilts) across most portfolios as ten-year gilt yields rose above 5% for the first time in over a decade.
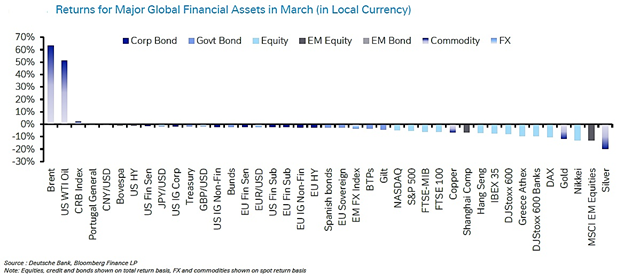
March 2026 was the most turbulent month for global markets since the pandemic, as US military strikes on Iran triggered a dramatic repricing across virtually every asset class. The S&P 500 posted its largest monthly decline in over a year, Brent crude its largest quarterly gain (94%) since the Gulf War, while gold fell sharply as deleveraging overtook defensive buying. The FTSE 100 and Emerging Markets held up better.
When Growth Fears Overtook Inflation Concerns
The key development was the pivot in bond markets. Investors initially pushed yields higher on inflation concerns, then reversed course as surging crude acted as a consumption tax rather than a demand-pull catalyst. Powell dampened rate-hike expectations, briefly driving an equity recovery.
Earnings Resilience and Stagflation Risk
Despite the macro shock, earnings estimates held up. Excluding the Magnificent Seven, 2026 estimates for the remaining S&P 500 constituents actually rose during March, putting a floor under valuations. With inflationary and stagflationary scenarios posing risks to conventional 60/40 models, and bond-equity correlations turning positive, a genuinely multi-asset, diversified approach is more important than ever.
SCM/MoneyShe Portfolios
When ten-year gilt yields crossed 5% on 20 March, their highest since the 2008 financial crisis, we identified a significant mispricing. The 80-basis-point spike since Operation Epic Fury was driven by term premium, not UK credit deterioration. We made two changes across most portfolios (excluding the ESG portfolio, which does not hold government bonds). We sold a 10% corporate bond allocation and bought a 15+ Year Gilt ETF, with 20-year yields at 5.58%. We replaced the 7% overnight-rate allocation with a UK Gilt 1–5 Year ETF, where five-year yields of 4.66% exceeded the 3.75% Bank Rate, increasing gilt exposure from 42% to 59% of the bond portfolio.
We believe the market is treating a transient energy shock as a structural crisis. In 2008, 5% gilt yields reflected bank failures and a credit freeze. Today, they reflect an oil price spike on an economy with GDP forecasts of 0.6% (Vanguard) to 1.1% (OBR).
Consider the real yield arithmetic: ten-year gilts yielded 5.05% against a breakeven inflation rate of approximately 3.5%, implying a real yield of around 1.5%. But that breakeven embeds energy-inflated expectations. If inflation returns to the Bank of England’s 2% target by late 2027, as forecasters expect, investors locking in at 5% earn a real yield above 3%, double the long-run average.
Two-year gilts at 4.66% price in rate hikes well above the 3.75% Bank Rate, yet the Bank views the inflation overshoot as temporary. The gilt–Bund spread above 200 basis points prices UK sovereign debt like peripheral Europe, despite Britain having its own central bank and currency.
Since execution, ten-year yields have fallen over 30 basis points to 4.71%. A further 100-basis-point decline could generate capital returns of 15–20% for the 15+ Year Gilt ETF, plus the running yield.
Alan Miller, Chief Investment Officer