


Bond Reserve Portfolio
Overview
To outperform cash.
Actively managed. This well-diversified portfolio is made up of cash, credit and fixed interest investments. It normally invests in a wide range of ETFs to gain significant diversification and exceptional liquidity at very low cost.
| Stock Short Name | Percentage of Portfolio |
|---|---|
| VANGUARD INV SER-UK GILT UCITS ETF | 20.9 |
| iShares Core UK Gilts UCITS ETF | 20.6 |
| SPDR Sterling Corporate Bond UCITS ETF | 10.8 |
| ISHARES II PLC-USD FLTG RATE BOND U | 9.8 |
| SPDR Bloomberg 15+ Year Gilt UCITS ETF | 9.7 |
| iShares Core £ Corp Bond UCITS ETF | 8 |
| Invesco UK Gilt 1-5 Year UCITS ETF | 7 |
| iShares GBP Ultrashort Bond UCITS ETF | 6.6 |
| iShares GBP Corp Bond 0-5yr UCITS ETF | 5.9 |
| Number of Holdings | Yield to Maturity | Maturity | Duration | S&P Rating |
|---|---|---|---|---|
| 143 Govt. Bonds 1,636 Corp. Bonds | 5.07% | 9.44 | 6.07 | A/A- |
| Bond Reserve | 4.1% |
|---|---|
| Asia Pacific Ex. Japan (MSCI Asia Ex Jap) | 18.30% |
| Em Markets (MSCI EM) | 17.30% |
| Japan (MSCI Japan) | 14.60% |
| US Equities (MSCI USA) | 12.50% |
| Europe Excl UK (MSCI Eur. Ex UK) | 11.10% |
| UK Equities (MSCI UK) | 9.40% |
| UK Index-Linked Gilts (Barclays UK Infl Linked) | 8.70% |
| UK Gilts (Bloomberg UK Govt All>1 Yr) | 7% |
| UK Corp Bonds (iBoxx Large Cap TRI Index) | 5.20% |
Performance is based on the monthly performance of the first client discretionary portfolio after all charges. Individual client portfolios may differ due partly to differences in the timing of initial investment or withdrawals or rebalancing. The MoneyShe Bond Reserve (GBP) Benchmark is the Barclays Benchmark Overnight GBP Cash Index. Competitor data is based on the performance of the IA Global Mixed Bond Sector and the comparison is offered as a guide only.
| 12m to 31/08/2026 | 12m to 31/08/2025 | 12m to 31/08/2024 | 12m to 31/08/2023 | 12m to 31/08/2022 | 12m to 31/08/2021 |
|---|---|---|---|---|---|
| 2.3 | 1.8 | 8.1 | 1.7 | -15.2 | 1.8 |
Source: SCM Private LLP
Past performance is not a guide to future returns. The value of investments and the income from them can go down as well as up, so investors may not recover the amount of their original investment.
| ALL Fees & Charges | Percentage |
|---|---|
| SCM Discretionary Fund Management Charge | 0.40% |
| Underlying ETF costs (KIID Ongoing Charge) | 0.19% |
| Transaction Costs of buying/selling funds | 0.12% |
| Transaction Costs within funds | 0.07% |
| Custody & Administration Fee | 0.12% |
| Total Fees & Charges | 0.90% |
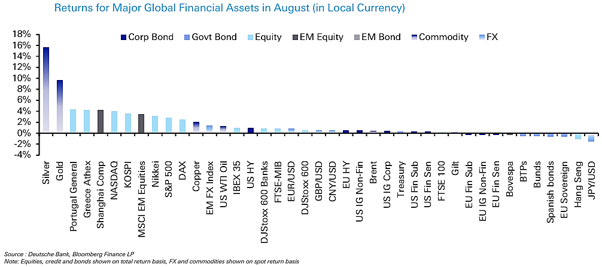
In August, we made no changes to the SCM/MoneyShe Portfolios. On the surface, it was a triumphant month: global equities rose 2.6% to fresh records, with Japan and emerging markets leading, and July’s momentum crash was repaired as semiconductors rebounded 10% from their trough. Beneath the surface, the bond market was setting the terms. Long-dated yields hit multi-year highs, gold rose by 9.7%, beating every stock market on earth, and the dollar fell again despite a more hawkish Federal Reserve.
The chart below shows August across the world’s major assets: silver and gold at one end, government bonds and the Hang Seng at the other – the mirror image of July.
A rally on borrowed money
How does a market rally while its cost of capital hits twenty-year highs? Partly on borrowed money. The AI build-out is increasingly funded with IOUs rather than cash flow: hyperscaler spending has pushed several giants into negative free-cash-flow territory, US investment-grade issuance is heading for a record year, and even SpaceX has now turned to the bond market. At Jackson Hole on 28 August, Chair Warsh made the Fed’s priority explicit: ‘its predominant focus right now should be on prices’. At that point, the odds of a September hike promptly doubled, while the US Treasury expanded its buybacks of long-dated debt, widely read as financial repression rather than a fiscal fix. Gold’s surge and the falling dollar were the market’s verdict.
Equities looked past it all: Europe posted a fifth consecutive monthly gain and a new record; second-quarter earnings beat expectations again; and credit barely moved, with investment-grade spreads within 8 basis points of the record tightness. But sentiment is at extreme levels, private-client cash is at record lows, and September to October is historically the weakest two-month stretch, based on data going back to 1928.
The dearest money since 2007
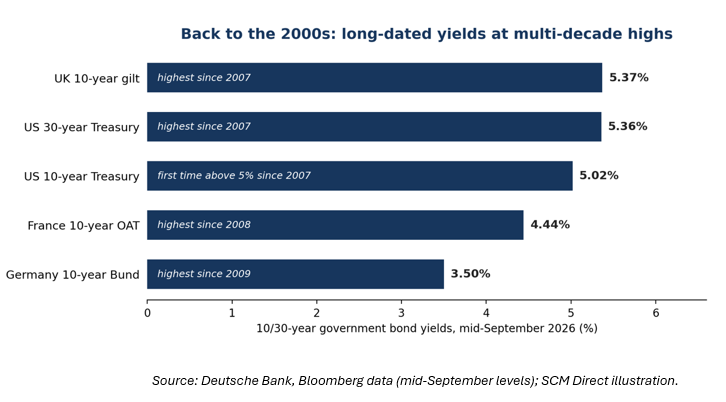
September has confirmed the shift. With Hormuz shut for a third month and Saudi supply disrupted, Brent surged above $107, and European gas hit a post-2022 high. The ECB raised rates to 2.50%, which President Lagarde called ‘a no-brainer’. The Federal Reserve followed with its first hike since 2023, to 3.75–4.00%, with a further 75 basis points priced in by next summer. Money has not cost this much since 2007.
The UK was the partial exception: 10-year gilt yields touched 5.37% before rallying as services inflation eased and the Bank of England held at 3.75%. At these levels, the mathematics favour the patient, as gilt coupons now cushion holders against far higher yields, and gilt yields near 5% against 3.1% inflation offer some of the best real returns in developed markets. A year that began with markets pricing rate cuts is ending with central banks tightening again. The inflation genie, as we have said all summer, is not back in the bottle.
SCM Direct/MoneyShe Portfolios
We do not chase records. The defensive styles we favour being low volatility, quality, dividends, and value have lagged the rally all year and now trade at depressed valuations: the unfashionable assets we prefer to own before the crowd returns. We remain focused on capital preservation, valuation discipline and genuine, look-through diversification, and continue to monitor developments very closely.
Alan Miller, Chief Investment Officer
17 September 2026