
Long-Term Return Portfolio
Overview
To outperform inflation.
Actively managed with a long-term bias to real assets e.g. equities. The Portfolio normally invests in a wide range of ETFs to gain significant diversification and exceptional liquidity at very low cost.
| Top 10 Holdings | % of Portfolio |
|---|---|
| Amundi UK Equity All Cap UCITS ETF | 10.6 |
| iShares Core FTSE 100 UCITS ETF | 9.7 |
| VANGUARD INV SER-UK GILT UCITS ETF | 8.3 |
| iShares Core UK Gilts UCITS ETF | 8.3 |
| Invesco FTSE RAFI US 1000 UCITS ETF | 7.7 |
| Amundi MSCI Japan UCITS ETF | 5.4 |
| SPDR Sterling Corporate Bond UCITS ETF | 4.3 |
| Vanguard FTSE 250 UCITS ETF | 4.2 |
| Invesco GBP Corporate Bond UCITS ETF | 3.9 |
| Invesco GBP Corporate Bond ESG UCITS ETF | 19.7 |
| Number of Holdings | Yield to Maturity | Maturity | Duration | S&P Rating |
|---|---|---|---|---|
| 148 Govt. Bonds 1,646 Corp. Bonds | 4.56% | 8.66 | 5.69 | A/A- |
| Number of Holdings | Best Dividend Yield Forward 12m | Best Price to Book Forward | Best P/E Ratio | Best LTG EPS |
|---|---|---|---|---|
| 7,920 | 2.8% | 2.9 | 14.9 | 11.85% |
| Long-Term Return | 6.6% |
|---|---|
| Asia Pacific Ex. Japan (MSCI Asia Ex Jap) | 13.5% |
| Em Markets (MSCI EM) | 13.0% |
| US Equities (MSCI USA) | 11.7% |
| Japan (MSCI Japan) | 11.8% |
| UK Index-Linked Gilts (Barclays UK Infl Linked) | 9.8% |
| Europe Excl UK (MSCI Eur. Ex UK) | 9.7% |
| UK Equities (MSCI UK) | 9.5% |
| UK Gilts (Bloomberg UK Govt All>1 Yr) | 6.8% |
| UK Corp Bonds (iBoxx Large Cap TRI Index) | 5.1% |
Performance is based on the monthly performance of the first client discretionary portfolio after all charges. Individual client portfolios may differ due partly to differences in the timing of initial investment or withdrawals or rebalancing. The SCM/MoneyShe Long-Term Return (£) Benchmark is inflation (the return of the UK RPI All Items Index). Competitor data is based on the performance of the IA Mixed Investment 40-85% Shares Sector and the comparison is offered as a guide only.
| 12m to 28/02/2021 | 12m to 28/02/2022 | 12m to 28/02/2023 | 12m to 29/02/2024 | 12m to 28/02/2025 | 12m to 28/02/2026 |
|---|---|---|---|---|---|
| 13.7% | 4.3% | -0.6% | 6.1% | 8.9% | 20.4% |
Source: SCM Private LLP
Past performance is not a guide to future returns. The value of investments and the income from them can go down as well as up, so investors may not recover the amount of their original investment.
| ALL Fees & Charges | Percentage |
|---|---|
| SCM Discretionary Fund Management Charge | 0.40% |
| Underlying ETF costs (KIID Ongoing Charge) | 0.16% |
| Transaction Costs of buying/selling funds | 0.12% |
| Transaction Costs within funds | 0.05% |
| Custody & Administration Fee | 0.12% |
| Total Fees & Charges | 0.85% |
No changes were made to the SCM/MoneyShe Portfolios during February.
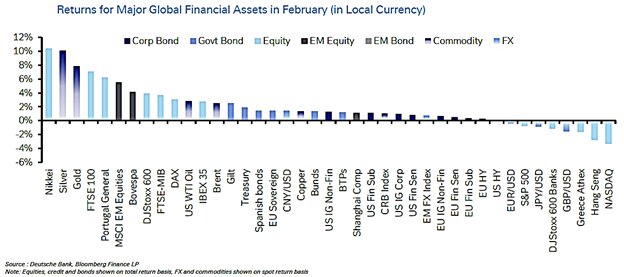
February presented a stark contrast to the optimism that had characterised the start of the year. The S&P 500 fell 0.8% as the Magnificent Seven declined 7.3%, led by a software sell-off of 8.9% in February alone and 20.8% year to date. A Bank of America fund manager survey found that, for the first time, most respondents believe companies are overinvesting in AI.
Outside the US, gains were broad-based: the FTSE 100 rose 3.0%, the STOXX 600 recorded an 8th consecutive monthly advance, and the Nikkei surged 10.4% to a new record. Gold rose 7.9% to $5,279/oz, while Brent settled at $ 72.48, and 10-year US Treasury yields fell 30 basis points to 3.94%. The February performance table illustrates this divergence, with the US a notable underperformer against a backdrop of strong international returns.
Geopolitics, Tariffs and the Supreme Court
The US Supreme Court ruled that using the International Emergency Economic Powers Act (IEEPA) to impose tariffs is unconstitutional. The President responded by invoking Section 122 of the Trade Act to impose a flat 10% tariff on all imports, citing a balance-of-payments emergency. The ISM manufacturing survey showed its strongest reading since 2022 but buried in the details were the highest figures for prices paid since early 2023 and growing complaints about tariff-related input costs.
Private Credit: The Next Shoe to Drop?
Perhaps the most underappreciated risk in markets is the stress in private credit. JP Morgan is marking down private credit loan portfolios and limiting exposure. Software is now the largest sector in US private credit, at 20 to 25% of the market, exceeding Telecom’s share in high yield in 2000. Around 15% of software leveraged loans now trade at distressed levels as AI threatens the per-seat pricing model. Around 70% of US Business Development Companies have quarterly liquidity capped at 5% of net asset value, and in several cases, outflows have already forced gating.
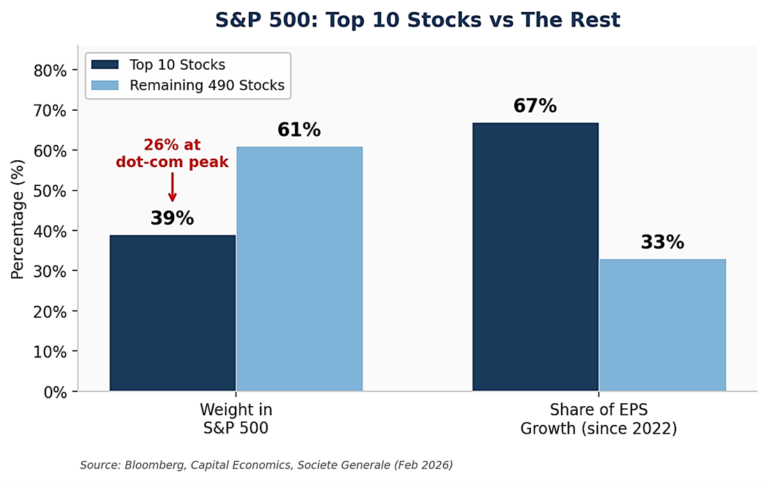
The End of Big Tech’s Profit Stranglehold
The top 10 US stocks now make up 39% of the S&P 500, compared to 26% at the peak of the dot-com bubble, and since 2022 have accounted for roughly two-thirds of the index’s earnings per share growth. That dominance is now cracking. Fourth-quarter earnings growth hit a four-year high of 14.5%, with 8 of 11 sectors posting gains and nearly half of all companies growing at double-digit rates. For anyone invested in a passive global equity tracker dominated by the Magnificent Seven (we do not hold such ETFs), February was a timely reminder of the benefits of diversification versus concentration.
SCM/MoneyShe Portfolios
The SCM/MoneyShe portfolios delivered strong returns in February, with broad international equity exposure, particularly in Europe and Japan, more than offsetting the drag from US markets.
The conflict in Iran and the disruption to the Strait of Hormuz have pushed Brent crude above $100 a barrel, unsettling equity and bond markets. The S&P 500 is now down over 2% for the year, while the FTSE 100 remains up nearly 4% in sterling terms. Global earnings growth is broadening, with European equities trading at 16 times forward earnings versus 23 times in the US for comparable expected growth. The SCM (MoneyShe) Portfolios are built on the principle of broad, low-cost diversification across geographies and asset classes rather than concentration in a handful of US technology names.
In periods of geopolitical stress, volatility and rising energy costs, this structure is designed to provide resilience. We continue to actively monitor developments closely.
Alan Miller, Chief Investment Officer
17 March 2026