Overview
Top 10 Holdings
Fixed Income by Asset Class
Underlying Holdings Key
Statistics – Fixed Income
Equities by Region
Underlying Holdings Key
Statistics – Equities
Last 3 Years Annualised
Volatility
Performance After Fees
Growth of £100,000
Rolling Return
Fees & Charges
Monthly Asset Allocation
Changes and Market
Commentary
Key Themes
Download Factsheet
Overview
Latest Factsheet and Market Commentary as at 31 May 2026
Portfolio commenced 8 June 2009
OBJECTIVE:
To outperform inflation.
STRATEGY:
Actively managed with a long-term bias to real assets e.g. equities. The Portfolio normally invests in a wide range of ETFs to gain significant diversification and exceptional liquidity at very low cost.
Overall Asset Allocation
Top 10 Holdings
| Stock Short Name | Percentage of Portfolio |
|---|---|
| iShares Core MSCI EM IMI UCITS ETF | 12 |
| VANGUARD INV SER-UK GILT UCITS ETF | 9.9 |
| iShares Core UK Gilts UCITS ETF | 9.7 |
| Amundi UK Equity All Cap UCITS ETF | 9.6 |
| iShares Core FTSE 100 UCITS ETF | 8.6 |
| Amundi MSCI Japan UCITS ETF | 5.2 |
| SPDR Sterling Corporate Bond UCITS ETF | 5.2 |
| SPDR Bloomberg 15+ Year Gilt UCITS ETF | 4.8 |
| ISHARES II PLC-USD FLTG RATE BOND U | 4.5 |
| Invesco FTSE RAFI US 1000 UCITS ETF | 3.8 |
Fixed Income by Asset Class
Underlying Holdings Key Statistics – Fixed Income
| Number of Holdings | Yield to Maturity | Maturity | Duration | S&P Rating |
|---|---|---|---|---|
| 140 Govt. Bonds 1,703 Corp. Bonds | 4.93% | 9.69 | 6.25 | A/A- |
Equities by Region
Underlying Holdings Key Statistics – Equities
| Number of Holdings | Yield to Maturity | Maturity | Duration | S&P Rating |
|---|---|---|---|---|
| 7,775 | 3.0% | 2.1 | 14.5 | 12.6% |
Last 3 years annualised volatility
| 50/50 Absolute Return/Long-Term Return | 7.2% |
|---|---|
| Asia Pacific Ex. Japan (MSCI Asia Ex Jap) | 19.0% |
| Em Markets (MSCI EM) | 17.9% |
| Japan (MSCI Japan) | 14.5% |
| US Equities (MSCI USA) | 13.2% |
| Europe Excl UK (MSCI Eur. Ex UK) | 11.4% |
| UK Equities (MSCI UK) | 9.7% |
| UK Index-Linked Gilts (Barclays UK Infl Linked) | 8.9% |
| UK Gilts (Bloomberg UK Govt All>1 Yr) | 6.9% |
| UK Corp Bonds (iBoxx Large Cap TRI Index) | 5.2% |
Performance After Fees
Growth of £100,000
Performance is based on the monthly performance of the first client discretionary portfolio after all charges. Individual client portfolios may differ due partly to differences in the timing of initial investment or withdrawals or rebalancing. The SCM 50/50 Absolute Return / Long-Term Return (£) Benchmark is the average of cash (Barclays Benchmark Overnight GBP Cash Index) and inflation (the return of the UK RPI All Items Index). Competitor data is based on the average performance of the IA Global Mixed Bond and the IA Mixed Investment 40-85% Shares Sectors and the comparison is offered as a guide only.
Rolling Return
| 12m to 31/05/2021 | 12m to 31/05/2022 | 12m to 31/05/2023 | 12m to 31/05/2024 | 12m to 31/05/2025 | 12m to 31/05/2026 |
|---|---|---|---|---|---|
| 19.8% | -2.7% | -3.1% | 12.0% | 5.7% | 17.6% |
Source: SCM Private LLP
The performance of the 50/50 portfolios has been calculated as the average performance of the two underlying portfolios after costs, from the common date of inception.
Past performance is not a guide to future returns. The value of investments and the income from them can go down as well as up, so investors may not recover the amount of their original investment.
Fee & Charges
| ALL Fees & Charges | Percentage |
|---|---|
| SCM Discretionary Fund Management Charge | 0.40% |
| Underlying ETF costs (KIID Ongoing Charge) | 0.15% |
| Transaction Costs of buying/selling funds | 0.12% |
| Transaction Costs within funds | 0.04% |
| Custody & Administration Fee | 0.12% |
| Total Fees & Charges | 0.83% |
Asset Allocation & Market Commentary – 17 June 2026
In May, we rebalanced all the MoneyShe/SCM Portfolios, completing the rotation into UK government bonds that we began in the Spring – a move made when gilt headlines were at their most alarming, and one that proved well-timed.
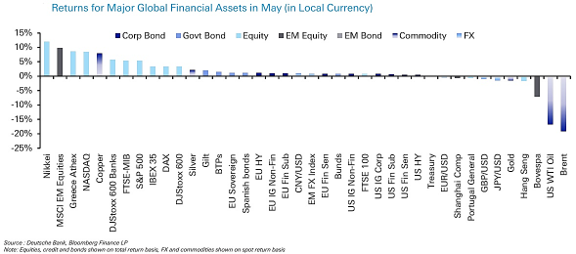
May was a risk-on month as hopes of a US-Iran deal firmed. Brent crude fell 19.3%, its biggest monthly decline since 2020, to around $92 a barrel, and with it, fears of stagflation receded. The S&P 500 rose 5.3% in total-return terms to a record high, the STOXX 600 gained 3.2%, and the Nikkei gained 11.9%.
The most speculative areas led: the Philadelphia semiconductor index rose 22.2%, and South Korea’s KOSPI 28.5% (up 102.4% this year). Sovereign bonds recovered towards the month-end as inflation worries eased.
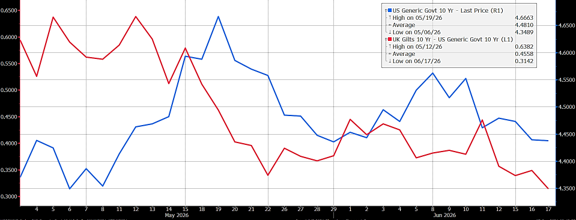
UK gilts: not believing the headlines
In mid-May, UK gilts were friendless. On 15 May, the 10-year yield hit a post-2008 high of 5.17% amid Labour’s local-election losses, ministerial resignations, and doubts over the fiscal rules. We judged the pessimism overdone and a yield above 5% to be good value. The May rebalance completed our build-out across short, conventional, and long maturities. Within days, gilts rallied: the 10-year closed at 4.81%, and gilts returned around 2.0% for the month. As the chart below shows, UK gilt yields fell substantially, and the premium of UK gilt yields over US government yields also declined. The SCM Ethical (ESG) Portfolio holds no government bonds, meeting its fixed-income exposure through screened corporate and ultra-short holdings.
Don’t be too relaxed about inflation
We caution against assuming oil-driven inflation will fade quickly. US headline CPI has risen above 4% for the first time in three years. The Federal Reserve’s stickier “supercore” measures are rising, and the NFIB small-business price index is at its highest level since 1981. UK inflation figures released this morning showed CPI was steady at 2.8% in the year to May, but services inflation picked up to 3.6%, a reminder that the stickier components have yet to ease. With Kevin Warsh chairing his first meeting and markets no longer expecting rate cuts, the risks remain skewed to the upside. Our focus on genuine diversification and on buying bonds at attractive yields is designed to help portfolios withstand that environment.
The insanity of SpaceX
If gilts were a study in excessive pessimism, SpaceX is the opposite. After May’s successful Starship maiden flight and Starlink price rises, it floated in mid-June in the largest listing in history and was soon valued at around $2.75 trillion. Alongside semiconductors, up by more than a fifth in a month, this shows how much optimism is embedded in the most fashionable assets, which are already volatile, with the Nasdaq 100 down around 7% from its peak and Oracle around 25%. We make no judgments about technology, but we stay broadly diversified rather than concentrating on a handful of fashionable names.
MoneyShe/SCM Portfolios
May was a strong month and a welcome contrast to early Spring. Broad international equity exposure captured the global rally, and the gilt positioning boosted returns. We continue to hold no gold, which fell for a third consecutive month.
We remain focused on capital preservation, valuation discipline and global diversification, and continue to monitor developments very closely.
Alan Miller, Chief Investment Officer
17 June 2026